
Healthcare reform and improvement has entered exciting times. Medical R&D and health informatics (HIT) are growing at a rapid rate, offering better options to a more curious and proactive generation of consumers. More regulatory bodies and forward-thinking policymakers are opening doors to the needs of underutilized professions and medically underserved areas. Industry titans are merging to consolidate profit while expanding services, and big non-healthcare companies are preparing to stake their claim.
With so many tiny moving pieces adopting reform and regulation at different rates, more than watching the US economy, healthcare stakeholders and consumers should watch the silent factors driving medical cost trends. As we reflect on the progress made in 2018, we turn to feasible ways to inch more of these tiny pieces closer to forming the bigger picture of more sustainable healthcare for all in 2019.
Moving Forward with Identifying Inflators
Annual surveys predict that although overall medical cost trend appears stable, we can still expect a 6% increase. This follows an unsustainable 5-year trend of 5.5%-7% increases in medical costs (physician services, hospital services, and prescription drugs). Research indicates this increase is caused by price inflation, not utilization.1
Experts found 3 main inflators for medical costs in 2019:
1. Demand for convenience 1
Today’s healthcare consumers are increasingly aware of what technology is capable of and what their health dollars are worth.
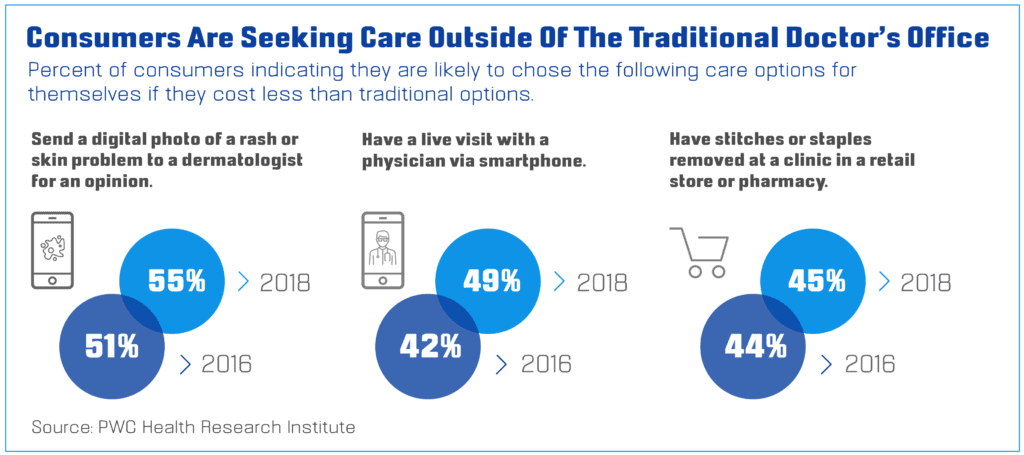
With the steady growth of cheaper telehealth apps and one-stop-shop models such as urgent care centers, more providers are investing in increasing healthcare access points to improve utilization. While this bodes well for long-term goals to patch up patient leakage and cut costs, the initial costs of adoption and implementation will continue to drive trends upward.
2. Accelerating MAP activity 3
The latest Health Leaders Media Mergers, Acquisitions, and Partnerships (MAP) Survey found that 71% of their affiliates only expect their MAP activity to grow, with 36% of respondents disclosing their organization is actively exploring and completing deals over the next 12-18 months.
With increasing market and regulatory pressures, smaller facilities that can’t afford to comply and expand are choosing between closing shop or signing a deal. Fewer and more formidable competition means bigger market shares and drastic shifts in pricing negotiation power.
3. Growing physician consolidation 1
In 2016, the number of physician-owned practices registered an all-time low of 47.1% since the American Medical Association’s (AMA) Physician Practice Benchmark surveys started monitoring the downward trend in 2012. A common example of this trend spurring costs is when patients see an institution-employed physician or specialist and must pay a separate professional fee on top of the facility’s.
In 2017, the Medicare Payment Advisory Committee (MedPAC) reported the average institutional clinic visit costing a total of $158, with at least $100 going to facility fees. MedPAC compared this to the average cost of $74.51 at physician-owned clinics and found patients are paying over 200% more in hospitals.
Additionally, prescription drug costs comprise 20%-25% of medical plans’ expenditures. This follows a promising downward trend over the last few years, almost coming to par with single-digit medical cost trends. While this is good news, plan sponsors and pharmacies are right to maintain efforts to manage this expense as prescription drug trends tend to outpace medical trends.2
Moving Forward with Pharmacy-Led Solutions
Pharmacies, whether retail or remote, are in a unique position to implement simple strategies that can sooner produce positive results in both cost management and access to healthcare. Experts suggest 5 potential solutions a pharmacy can spearhead:
 1. Diversify Services Pharmacies can help retain market share by diversifying patient care services and stratifying responsibility over these services between pharmacists and technicians.
Examples of these include:
- Health screenings and lab testing
- Vaccines and niche immunizations
- Wellness programs (ex. Weight management, smoking cessation, chronic disease management)
- Holistic health products (ex. Natural supplements, vitamins, essential oils)
 2. Specialty Pharmacy Services and Products Delving into specialty pharmacy is not without its own risks and technological challenges, but because specialty pharmacy fills contribute 24% of total retail pharmacy revenue, taking the time to study any unmet specialty needs in a community may help drive revenue and new patients.6
 3. Choose the Right Technology Shopping for new pharmacy technology can be less daunting once objectives are clearly established. Simply identifying which technical or auditing tasks take up the most time can lend clarity.
Examples of exciting technology to invest in include:
1. Automation and robotics can expedite measuring, filling, labeling and dispensing medications
2. Adherence and packaging technologies address patient adherence by providing custom packaging for specially -formulated and -measured medication. Optimize this strategy with a database of quick-print resources for your patient to take home.
3. Digital prescription and refill technologies – aside from boosting order volume, staff productivity and prescription pick-up rates – bode especially well for patient satisfaction objectives. When patients are provided refill reminders and the foresight to plan their day around a prescription pick-up, patients perceive empathy and respect for their time.
4. Pharmacy management software technologies help the business operations side of a pharmacy run smoother and frees up significant time for pharmacists to deliver patient care services.
5. All-in-one drug references and tools can easily be tailored to fit existing HIT systems. Invest in a product that offers a large drug database and comprehensive, yet immediately actionable clinical content.
Leverage this investment with a powerful PGx-ready Drug Interaction Checker that allows 3 key functionalities:
- Automatically sync and store PGx test results with patient records from external testing sites or enter results manually
- Conduct PGx queries independent of test results for sound alternative treatment recommendations
- Full interaction monographs that are bulleted, weighted, and immediately actionable
 4. Secure CPAs or Collaborative Practice Agreements with other providers in the community, which specify which patient care services fall under the pharmacist’s purview. This strategy requires social investment with physicians, as the bedrock of any provider collaboration is communication, trust, and credibility.
 5. Let Them “Shop the Whole Store” by stocking everyday items. Every time a patient leaves with just his prescription, the pharmacy misses an opportunity to increase revenue. Get into the consumer’s mind and strategize product placement according to different patients’ predictable shopping paths.
[elfsight_social_share_buttons id=”3″]
>> Join the Movement at ASHP Midyear 2018
If You’re Considering Implementing RPM, Consider PEPID
Meet Us at Booth #513
Resources:
- “Medical Cost Trend: Behind the Numbers 2019.” PwC, https://www.pwc.com/us/en/health-industries/health-research-institute/assets/pdf/hri-behind-the-numbers-2019.pdf.
- Burns, Erin. “Increases in Medical and Rx Cost Trends Projected to Be Lower for 2019, According to The Segal Group.” Business Wire, The Segal Group, 18 Sept. 2018, https://www.businesswire.com/news/home/20180918005176/en/Increases-Medical-Rx-Cost-Trends-Projected-2019.
- Bees, Jonathan. “71% of healthcare orgs say mergers and acquisitions will increase.” Health Leaders Media, 30 Apr. 2018, https://www.healthleadersmedia.com/strategy/71-healthcare-orgs-say-mergers-and-acquisitions-will-increase.
- Kane, Carol K. “Updated Data on Physician Practice Arrangements: Physician Ownership Drops Below 50 Percent.” American Medical Association, May 2017, https://www.ama-assn.org/sites/default/files/media-browser/public/health-policy/PRP-2016-physician-benchmark-survey.pdf.
- “The Top 6 Challenges Facing Community Pharmacy in 2019 – Are You Ready?” Independent Pharmacy Insights, AlliantRx, 20 Sept. 2018, http://www.alliantrx.com/blog/the-top-6-challenges-facing-community-pharmacy-in-2019-are-you-ready.
- Fein, Adam. “The 2018 Economic Report on US Pharmacies and Pharmacy Benefit Managers.” Drug Channels Institute, drugchannelsinstitute.com/files/2018-PharmacyPBM-DCI-Overview.pdf